In the style of a TV-review show
Showing posts with label Evaluation. Show all posts
Showing posts with label Evaluation. Show all posts
Thursday, 26 February 2015
Saturday, 21 February 2015
Friday, 20 February 2015
Wednesday, 18 February 2015
Thursday, 12 February 2015
Tuesday, 10 February 2015
Saturday, 7 February 2015
Wednesday, 4 February 2015
Wednesday, 28 January 2015
My Response to Audience Feedback: Magazine Article
A brief video simply covering the audience feedback I received regarding my film and some initial improvements that I could have made based on the feedback given:
My Response to Audience Feedback: Poster Campaign
A brief video simply covering the audience feedback I received regarding my film and some initial improvements that I could have made based on the feedback given:
My Response to Audience Feedback: Film
A brief video simply covering the audience feedback I received regarding my film and some initial improvements that I could have made based on the feedback given:
Thursday, 22 January 2015
Audience Feedback: Magazine Article Survey Responses
From the survey I sent out to my target audience, I received the following responses:


I then used Microsoft Excel to create graphs and charts for the results from questions 1 to 9 as a clear visual representation of my audience feedback:


I then used Microsoft Excel to create graphs and charts for the results from questions 1 to 9 as a clear visual representation of my audience feedback:
Audience Feedback: Poster Campaign Survey Responses
From the survey I sent out to my target audience, I received the following responses:


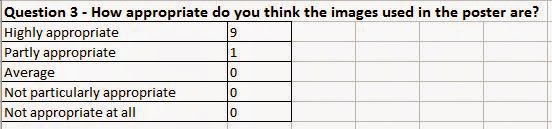


I then used Microsoft Excel to create graphs and charts for the results from questions 1 to 9 as a clear visual representation of my audience feedback:


I then used Microsoft Excel to create graphs and charts for the results from questions 1 to 9 as a clear visual representation of my audience feedback:
Audience Feedback: Film Survey Responses
From the survey I sent out to my target audience, I received the following responses:


I then used Microsoft Excel to create graphs and charts for the results from questions 1 to 9 as a clear visual representation of my audience feedback:


I then used Microsoft Excel to create graphs and charts for the results from questions 1 to 9 as a clear visual representation of my audience feedback:
Subscribe to:
Posts (Atom)